 Task
3. Identification of Critical Areas
Task
3. Identification of Critical Areas
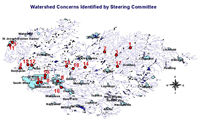 |
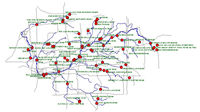
Site specific watershed concerns identified by Steering Committee. Click image for a larger view and descriptions. |
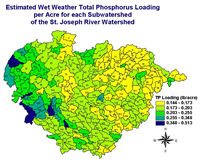 |
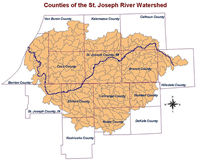
Nonpoint Source Loading: Modeling of Total Phosphorus and Total Suspended Solid Loads from each Subwatershed |
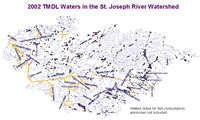 |
Impaired waterbodies on the 303(d) lists. Click image for a larger view and more information. |
|
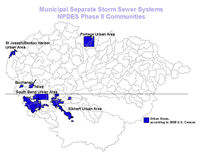
Communities regulated by Phase II of the NPDES Program. Click image for a large view and to link to USEPA information. |
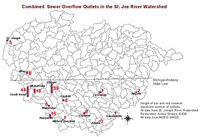 |
Combined Sewer Overflow Outfalls in the watershed. Click image for a larger view. |
 |
USEPA Enviromapper for Watersheds. Click image to access maps of federally regulated facilities. |
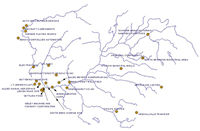 |
Federally regulated facilities in the watershed including NPL, NPDES, RCRA. Click image to view these maps. |
 |
Dams in the watershed. Click image for a larger view. |
|
Indiana Fish Advisories by County: Click Indiana Portion of Map. |
|
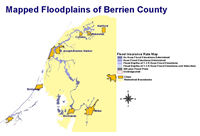
Available electronic flood plain maps |
|
 |
Quantification of sediment loading from road-stream crossings in Michigan. |
|
View water quality data from stations surveyed by volunteers during the World Water Monitoring Day, sponsored by America's Clean Water Foundation and the International Water Association:
- St. Joseph River below Berrien Springs Dam, Michigan
- St. Joseph River at Riverview Park, St. Joseph, Michigan
- Cobus Creek at Old Elkhart Conservation Club, Elkhart, Indiana
- Turkey Creek at CR142 Bridge, Goshen, Indiana
- Fawn River at Stubey Road, Sturgis, Michigan
- Fawn River at County Farm Road, Sturgis, Michigan
Elkhart County Health Department Surface Water Monitoring Data
Confined
Animal Feeding Operations
Indiana is one of the top ten states in the U.S. for layer, turkey and
hog production.
Michigan is in the top ten for dairy cattle populations.
View
the USEPA maps illustrating these trends.
Pages extracted from the Lake Michigan Lakewide Management Plan (2000) quantifying tributary loading to Lake Michigan: